
The question we kept coming back to during this research: is Litmaps actually useful, or is a pretty graph just a pretty graph? We pulled vendor documentation, Reddit threads, G2 write-ups, and Capterra feedback to find out. The answer isn't simple.
Litmaps launched in 2020 out of Dunedin, New Zealand. One core idea: drop in academic papers, get back a live interactive graph showing how they cite each other and what cites them. Not a reading list. A network. That pitch has attracted 350,000-plus users across 150 countries, which is a real number for a tool with this narrow a focus.
What is Litmaps?
You feed it papers, DOIs, or batches of papers, what the tool calls "seeds." Litmaps builds a visual map of citation relationships, lets you spot clusters, find gaps, and trace how research lineages branch. The visual graph format is genuinely different from how most literature review tools present information, and that difference shows up in user feedback constantly, across platforms, from people who aren't being paid to say it.
A self-identified dyslexic early-career researcher described the date-versus-citation layout as less intimidating than a standard database interface. That tracks. Spatial thinkers get something real out of this. Not everyone, but enough to matter.
Litmaps Features: Search, Synthesis & Research Capabilities

The free plan caps you at basic search, up to 20 inputs, two Litmaps, and 100 articles per map. Pro removes those ceilings. That gap is wider than it first looks, because a literature review that runs past 20 seed papers, which happens fast in most fields, hits the free limit before the project is half-built.
Alerts run on all three plans, but the cadence differs. Free users get monthly updates. Pro and Team users get weekly alerts, and those are configurable. For a researcher monitoring an ongoing project, weekly versus monthly is not a minor distinction.
The Zotero situation has changed meaningfully. Pro now includes a documented two-way Zotero Sync. Papers added or removed in a connected Zotero collection update in Litmaps tags, and vice versa. Free users can still bring in references manually via BibTeX or RIS imports. Honestly, that's more than we expected from a free tier. Fair.
There's no official Litmaps browser extension; the vendor's only mentioned extension is a third-party Google Translate plugin used as a translation workaround. There's no such Google Scholar add-to-Litmaps capability either, since no official extension exists. It's flagged as an early testing build. Treat it accordingly, but the direction is right.
AI summarization isn't publicly documented, and we couldn't confirm it exists. Multi-source synthesis happens through the citation network itself, not through any AI-generated text layer. That's a real gap compared to tools like Elicit, which synthesizes across abstracts and surfaces structured findings. Different jobs, but worth knowing which one you need before you pay.
Litmaps Research Quality: How Accurate and Trustworthy Is It?
Litmaps doesn't generate claims. It maps citation relationships. That distinction matters enormously when accuracy is the question. The tool's reliability is tied entirely to the underlying academic database, not to any reasoning layer that could hallucinate or misattribute a finding. There's no fact-checking feature, and there doesn't need to be. The risk of getting something factually wrong is low because the tool doesn't tell you what papers say, only how they relate.
That's both the strength and the ceiling. Fair.
Where researchers flag problems is database coverage. We saw recurring complaints about niche subfields showing up thin. If your field doesn't publish heavily in English, or isn't well-indexed in the underlying sources, the map gets sparse fast and that's a real problem, not a minor quibble.
Litmaps Source Coverage: What Does It Actually Search?
The coverage picture is clearer now than it was. Litmaps publishes indexing information directly. Their database holds 270 million-plus articles, with Semantic Scholar named by Litmaps' own CTO as the underlying data provider. Covered sources include PubMed, arXiv, and bioRxiv, plus Web of Science and Scopus. Credible stack.
We're less bothered by the old opacity complaint. Knowing what's in your database is a basic research hygiene question, and Litmaps has started answering it clearly. The comparison to Semantic Scholar, which has long published corpus data, is less damning than it was twelve months ago.
The language limitation is real and it's not going away. English-first publishing communities get better map density. Researchers whose fields publish heavily in other languages will hit gaps, and a large indexed database doesn't fix that if the papers simply aren't in it.
Is Litmaps Easy to Use for Researchers and Professionals?
The visual graph interface is the main usability argument, and users respond to it. We kept seeing comments from newer researchers, students especially, describing the map format as a faster way to orient in an unfamiliar field. Spatial layout of citation clusters does a job a flat reading list can't do.
Friction appears at the free tier limits. Two Litmaps and 100 articles per map on the free plan is enough to test the concept, but serious literature reviews outgrow it fast. The upgrade prompt arrives at exactly the moment a researcher is starting to depend on the tool. That's not accidental.
No mobile app. Web only. Not a dealbreaker for desktop-heavy academic workflows, but worth knowing before you commit.
Litmaps Pricing: Is It Worth It vs Free Alternatives?
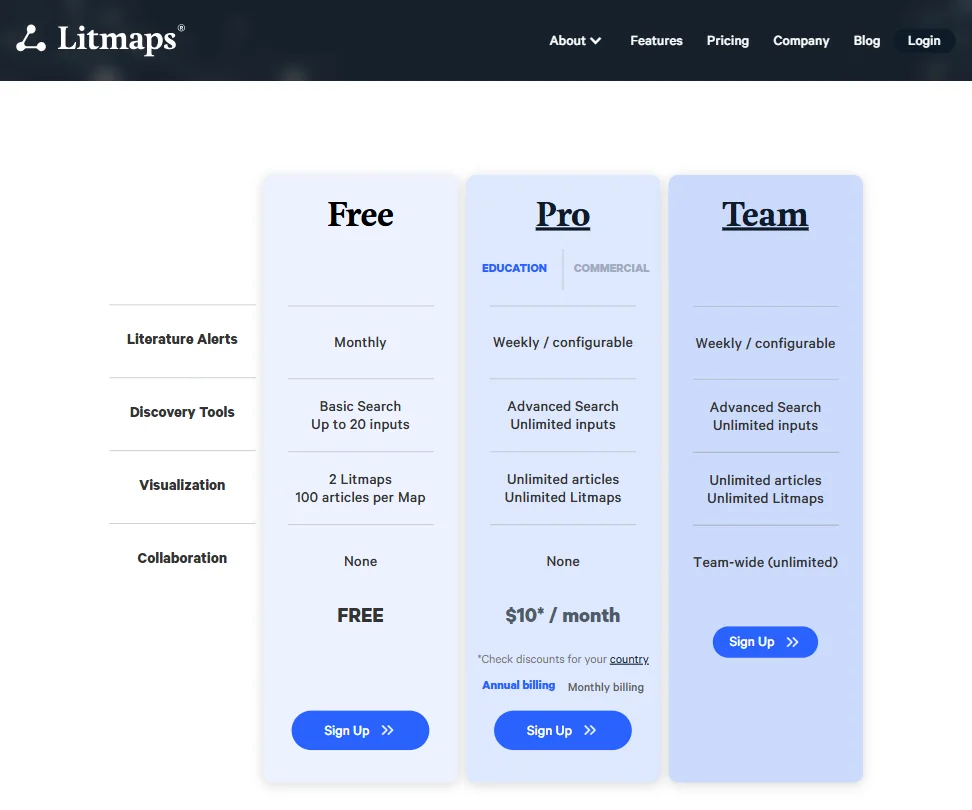
Pro on the academic plan is $10 per month on annual billing, or $12.50 per month billed monthly (the commercial plan runs $40 or $50 per month). Country-based discounts are available. The free tier is real and functional. Two maps and 100 articles per map isn't generous, but it's enough to evaluate whether the format actually works for you before paying anything. Team pricing requires contacting sales, which is standard practice and mildly annoying.
What's missing is a public refund policy. We couldn't find one. That's a minor but genuinely frustrating omission, especially for students on tight budgets who are trialing a paid subscription for the first time.
The ResearchRabbit comparison has gotten more complicated. For a long time, ResearchRabbit was simply free and that was the whole argument. In 2025, ResearchRabbit introduced ResearchRabbit+, at $10 per month on annual billing or $12.50 month-to-month. That tier adds up to 300 seed papers, multiple projects, and advanced controls. So the free-versus-paid framing no longer holds. Both tools now charge $10 at the paid level. The question becomes which feature set fits the workflow, not which costs less.
Litmaps vs ResearchRabbit: Which AI Research Tool Is Better?
ResearchRabbit is still the most direct overlap. Both build citation networks from seed papers. Both surface related literature you'd otherwise miss. Pricing parity at $10 per month shifts the conversation from value to capability.
ResearchRabbit+ caps seeds at 300 papers and supports multiple projects. Litmaps Pro offers unlimited inputs and unlimited maps. We'd give Litmaps the edge on scale. ResearchRabbit has had Zotero integration longer, though, and that integration has more user-reported stability behind it. We're not dismissing that.
Configurable weekly alerts for new papers matching your map is where Litmaps makes its clearest argument for the monitoring use case. Documented cadence, user-reported reliability, meaningful for long-term projects. For a one-off literature review, the differences between the two tools narrow considerably.
Scite sits in a different lane entirely, focused on citation context and whether papers support or contradict each other. Different job. Different budget. Worth mentioning but not a real competitor here.
Who Should Use Litmaps? (And Who Shouldn't)
PhD students running long literature reviews. That's the clearest fit. The visual format helps with orientation, and the monitoring alerts help with staying current over months or years of work.
Early-career researchers in well-indexed English-language fields will get the most out of it. Researchers in niche, non-English, or under-indexed subfields will hit coverage gaps before the tool has a chance to help them, and that's a real risk worth weighing.
Anyone who needs AI synthesis across papers should look elsewhere. Litmaps maps. It doesn't read, summarize, or synthesize. Not a criticism, just a fact about what the product actually does.
Litmaps Review Verdict
Litmaps does one thing well. The citation network visualization is genuinely useful, not window dressing. Real researchers with real projects use it to find papers they would have missed and to understand how a field has developed over time.
The weak spots are real. AI synthesis is absent, and researchers who want to move from discovery into summarization will need a second tool for that job. The free tier is honest about its limits. Ten dollars per month on the academic plan is fair if the map format is core to your workflow, and $12.50 month-to-month (the commercial plan runs $40 to $50). The Zotero sync is a genuine improvement; there's no official Chrome extension, only a third-party Google Translate plugin mentioned as a workaround. We'd have been more skeptical of this tool twelve months ago than we are now.
Coverage transparency has improved. Integration has improved. The core visualization hasn't needed to change because it was the right idea from the start.
How Litmaps compares
Litmaps scores 4.0 out of 10 among the literature search tools we rate. These three do the same job and are the closest to it, compared on what each vendor publishes.
ResearchRabbit
Litmaps and ResearchRabbit both charge $12.50 a month for their cheapest paid plan. Litmaps sends alerts when new papers matching your map appear, a feature ResearchRabbit does not have. ResearchRabbit answers back with shared team projects included on its free plan, where Litmaps only adds collaboration on its pricier Team tier, and ResearchRabbit also states it does not train AI on your data, a policy Litmaps does not publish either way.
Pick ResearchRabbit if you want free team collaboration and a stated privacy policy.
Pick Litmaps if you want alerts when new matching papers are published.
Semantic Scholar
Semantic Scholar is free, with no paid plan; Litmaps costs $12.50 a month for its cheapest plan. Litmaps answers back with a visual citation map connecting related papers, the core of the product, which Semantic Scholar does not offer. Semantic Scholar has a free, documented API and a browser extension, both missing from Litmaps, and it syncs with Zotero, Mendeley and EndNote where Litmaps only connects to Zotero.
Pick Semantic Scholar if you want a free plan with an API and browser extension.
Pick Litmaps if you want a visual map of how papers connect.
Elicit
Litmaps costs $12.50 a month; Elicit's academic plan is $19 a month. Litmaps answers back with a visual citation map showing how papers connect, which Elicit does not offer. Elicit goes much further otherwise: it answers research questions with a written, cited answer, reads figures and tables inside papers, and screens references for a systematic review, none of which Litmaps does, since Litmaps is built for discovery and mapping rather than reading or analysis.
Pick Elicit if you need answers, figure reading or systematic review screening.
Pick Litmaps if you want to see how papers cite and relate to each other.
Frequently Asked Questions
Is Litmaps free to use?
Yes, there's a genuine free tier. It covers up to two Litmaps and 100 articles per map, with basic search and monthly alerts. That's enough to evaluate whether the visual format works for you, but serious projects will outgrow it quickly. Free users can import references via BibTeX or RIS if they want to bring in an existing library without upgrading.
How does Litmaps compare to Connected Papers?
Both tools build visual citation graphs from seed papers. Connected Papers has a well-known free tier with a limited number of graphs per month. Litmaps adds automated monitoring alerts, which Connected Papers doesn't match at the same cadence. For ongoing research spanning months, Litmaps' configurable weekly alerts are the stronger argument for paying. For a single field snapshot, the tools are more comparable than their pricing difference suggests.
Does Litmaps work for non-English research?
Not well. The platform skews English-first, and non-English academic literature will show up thin, or not at all, in many cases. The 270 million-plus article database is large, but coverage is uneven across languages. Researchers whose fields publish heavily outside English should factor that in before committing to a paid plan.


